The rise of the industrial economy in the 70s had the working population in Massachusetts strive to get a full time job with an employer and show up for work. It has been the norm for decades, but if we study the shift in employment statistics closely, there is a big revolution in the making.
The working population in Massachusetts is currently witnessing a post-industrial shift into a self dependent economy. Gen Z doesn’t want to fit in the industrial complex and look for flexibility and satisfaction in their job.
How big is the gig economy workforce in Massachusetts?
27% of the small business workforce in Massachusetts work as independent workers.
Comparative analysis of gig economy and employment datasets for small businesses suggest a dramatic shift in how working population in Massachusetts work: 27% of the small business workforce work as independent workers. In Massachusetts there are 576,528 self employed gig workers ( freelancers and contractors ) compared to 1,536,912 salaried employees in small business payroll ( firms with less than 500 employees).
The gig economy workforce of self employed independent contractors, freelancers, also identified as non employer firms are becoming an important factor in Massachusetts. As per the current 2019 NES ( released on June 30, 2022) there are 576,528 gig businesses in Massachusetts, up from 472,534 in 2010.
This increase in the gig worker population can be safely related to increase in employment opportunities created by the rise of online platforms such as Uber, Lyft, Airbnb, TaskRabbit.
Which industries contribute the most to the gig economy in Massachusetts?
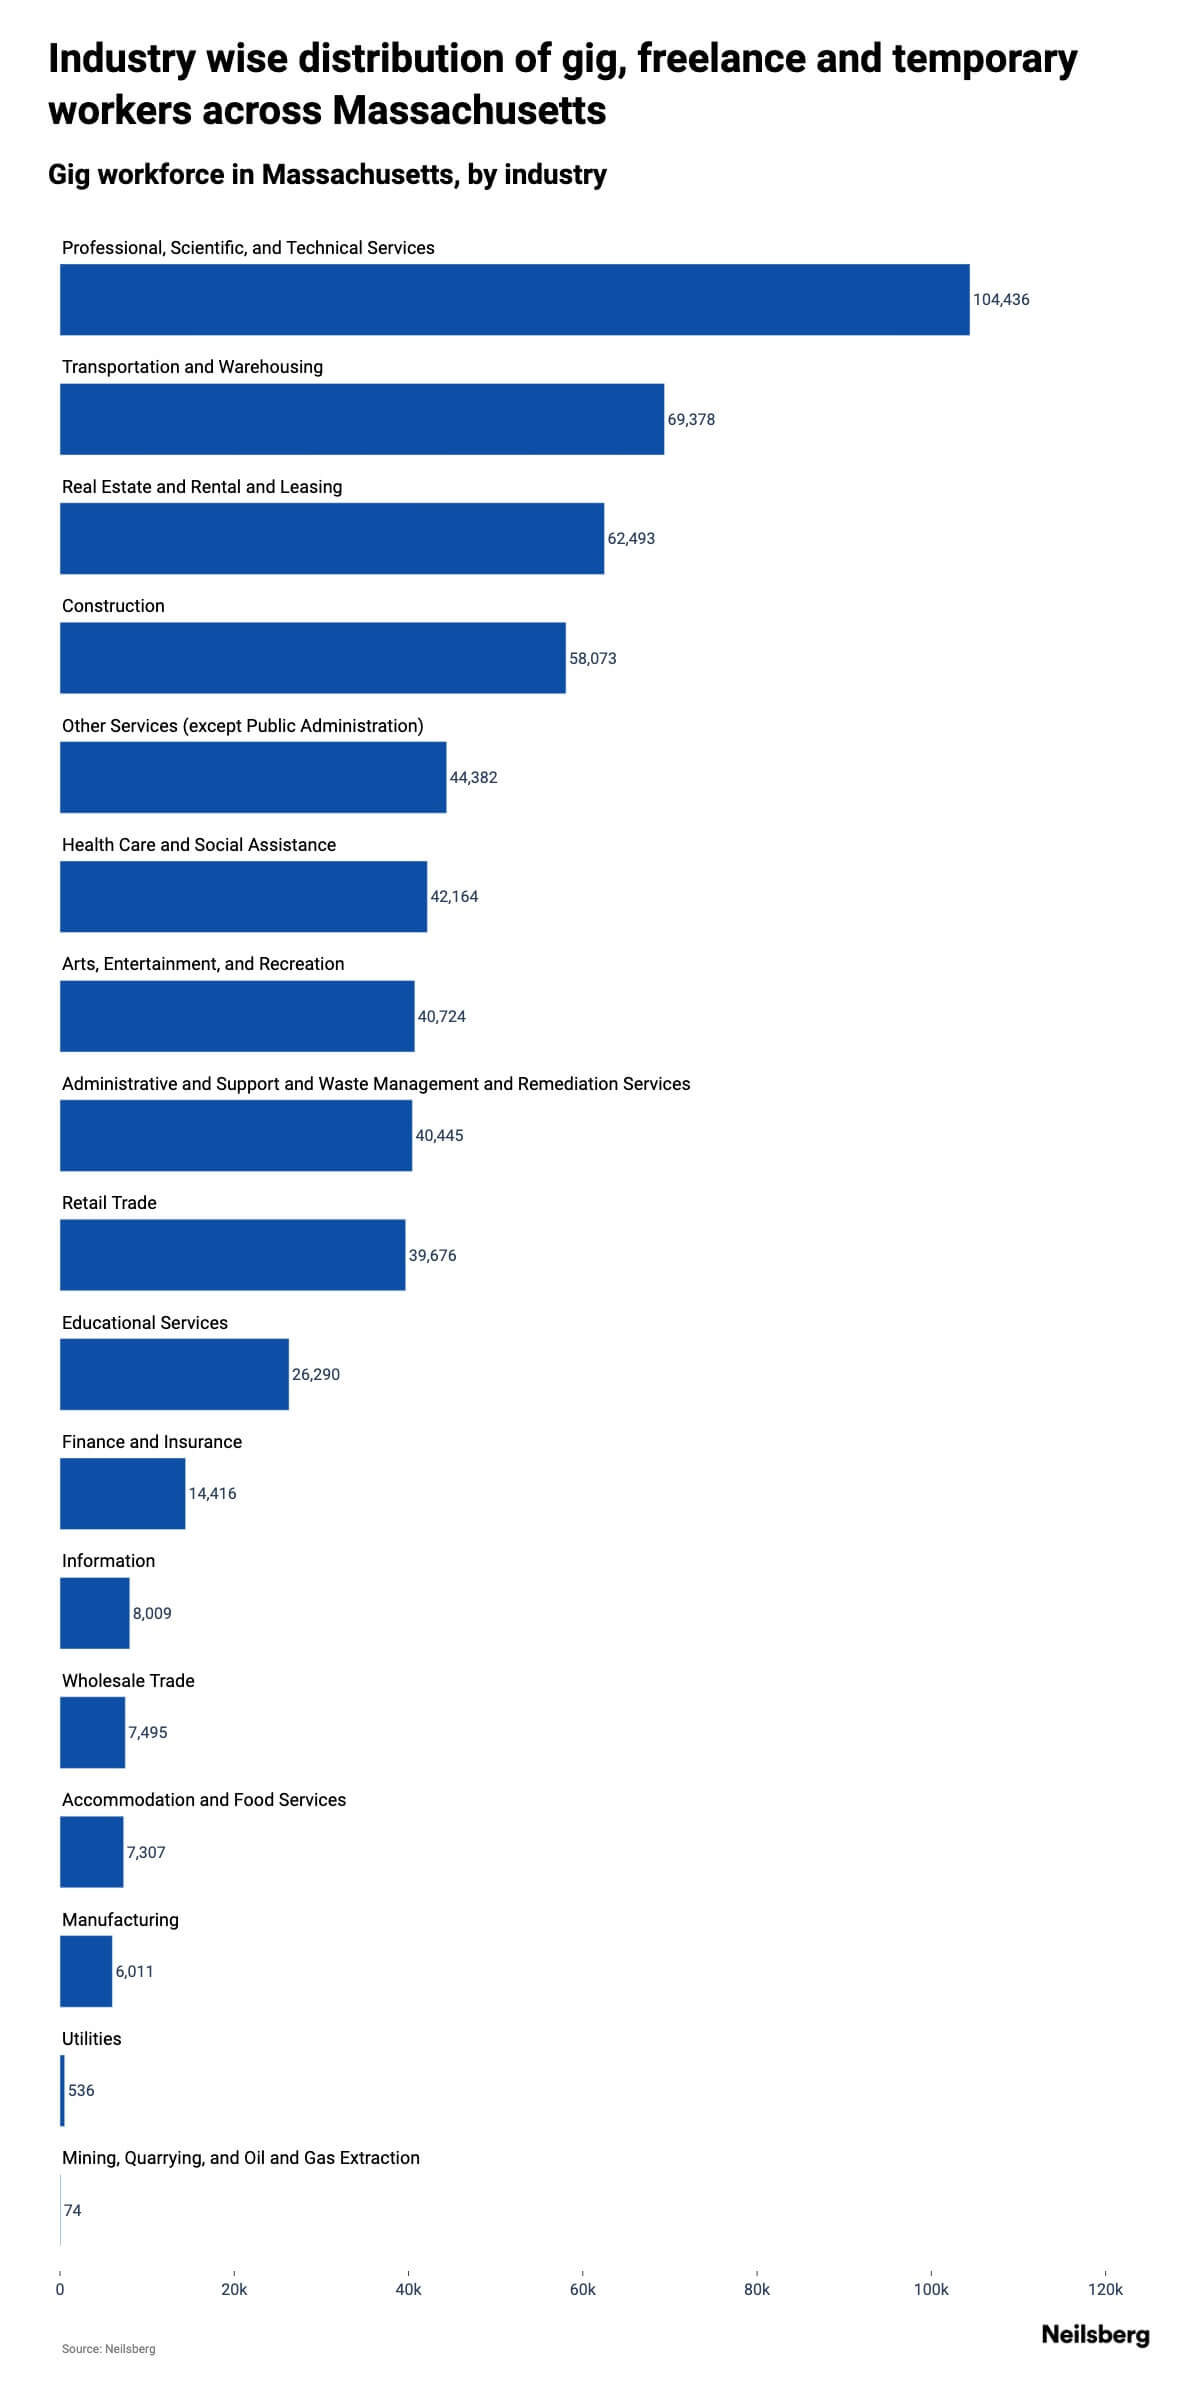
The sector " Professional, Scientific, and Technical Services " contributed the most whereas the lowest contribution came from Mining, Quarrying, and Oil and Gas Extraction sector.
We aim to look at the distribution of gig economy workforce across broad 17 industry levels as defined under NAICS. As per the current 2019 NES ( released on June 30, 2022), there are 1 sectors with more than 100,000 gig workers. The sector " Professional, Scientific, and Technical Services " contributed the most with the number of gig workers as 104,436. The lowest contributor to the gig economy was the Mining, Quarrying, and Oil and Gas Extraction sector with just 74 gig workers across Massachusetts. The number of gig "businesses" according to the respective industry sectors is exhibited in the table below.
The next important thing to analyze is change in the gig economy workforce across different industries over the last decade. This analysis will help us determine the true drivers in the rise of gig economy in Massachusetts. Analysis of the data suggests that the biggest driver in the gig economy across Massachusetts is the Transportation and Warehousingsector. The number of gig workers increased by 326% from 16,287 in 2010, increasing to 69,378 in the data from the current reference year NES 2019.
For the same time period, the biggest loss of 8,755 was witnessed in the Other Services (except Public Administration) sector. The overall decline in this sector over the last decade was at 16%, witnessing a decrease to 44,382 ( in 2019 ) from 53,137 ( in 2010).
The change in the number of gig "businesses" according to the respective industry sectors over the data analysis of last 10 reference years in NES is exhibited in the table below.
Which counties contribute the most to the gig economy in Massachusetts?
The top 5 counties have 70.40% of the entire 576,528 gig workforce
Looking at the county distribution for the gig economy workers across Massachusetts, the top 5 counties have 70.40% of the entire 576,528 gig workforce.
On the other hand the lowest contributing locations contribute approximately 6.49% of the state level gig workforce with 37,392 gig workers in total among them.
As expected, the top counties with the most number of gig workers are also the counties with the highest growth percentage of gig workers over the last decade. The best growth achieved is by Middlesex county, where the number of gig workers increased 18% from being 124,404 in 2016 to 147,204 in 2019 ( the latest reference year for NES as per the release on Jun 30 2022).
Who does gig work and what are the demographic profile of gig economy workers in Massachusetts?
Across Massachusetts, the number of male workers in gig economy stood at 326,000 compared to 224,000 female workers
Across Massachusetts, the gig work runs through every demographic profile criteria. As some of the the gigs such as delivering packages, food, driving passengers have low entry barriers work has a low barrier to start with, a lot of younger and population that is not economically established tend to take up these gigs more than the rest of population.
To get more details, we analyzed the most current Nonemployer Statistics by Demographics. We found that across Massachusetts, the number of male workers in gig economy stood at 326,000 compared to 224,000 female workers.
The distribution on the basis of ethnicity was stark and the number of non hispanics in the gig workforce stood at 515,000 compared to 45,000 workers with ethnicity as hispanic.
On the basis of race the number of gig workers from the white population was found to be 479,000 compared to the 42,000 from black and 38,000 asian population.
