About this dataset
Context
The dataset tabulates the Whitewater population over the last 20 plus years. It lists the population for each year, along with the year on year change in population, as well as the change in percentage terms for each year. The dataset can be utilized to understand the population change of Whitewater across the last two decades. For example, using this dataset, we can identify if the population is declining or increasing. If there is a change, when the population peaked, or if it is still growing and has not reached its peak. We can also compare the trend with the overall trend of United States population over the same period of time.
Key observations
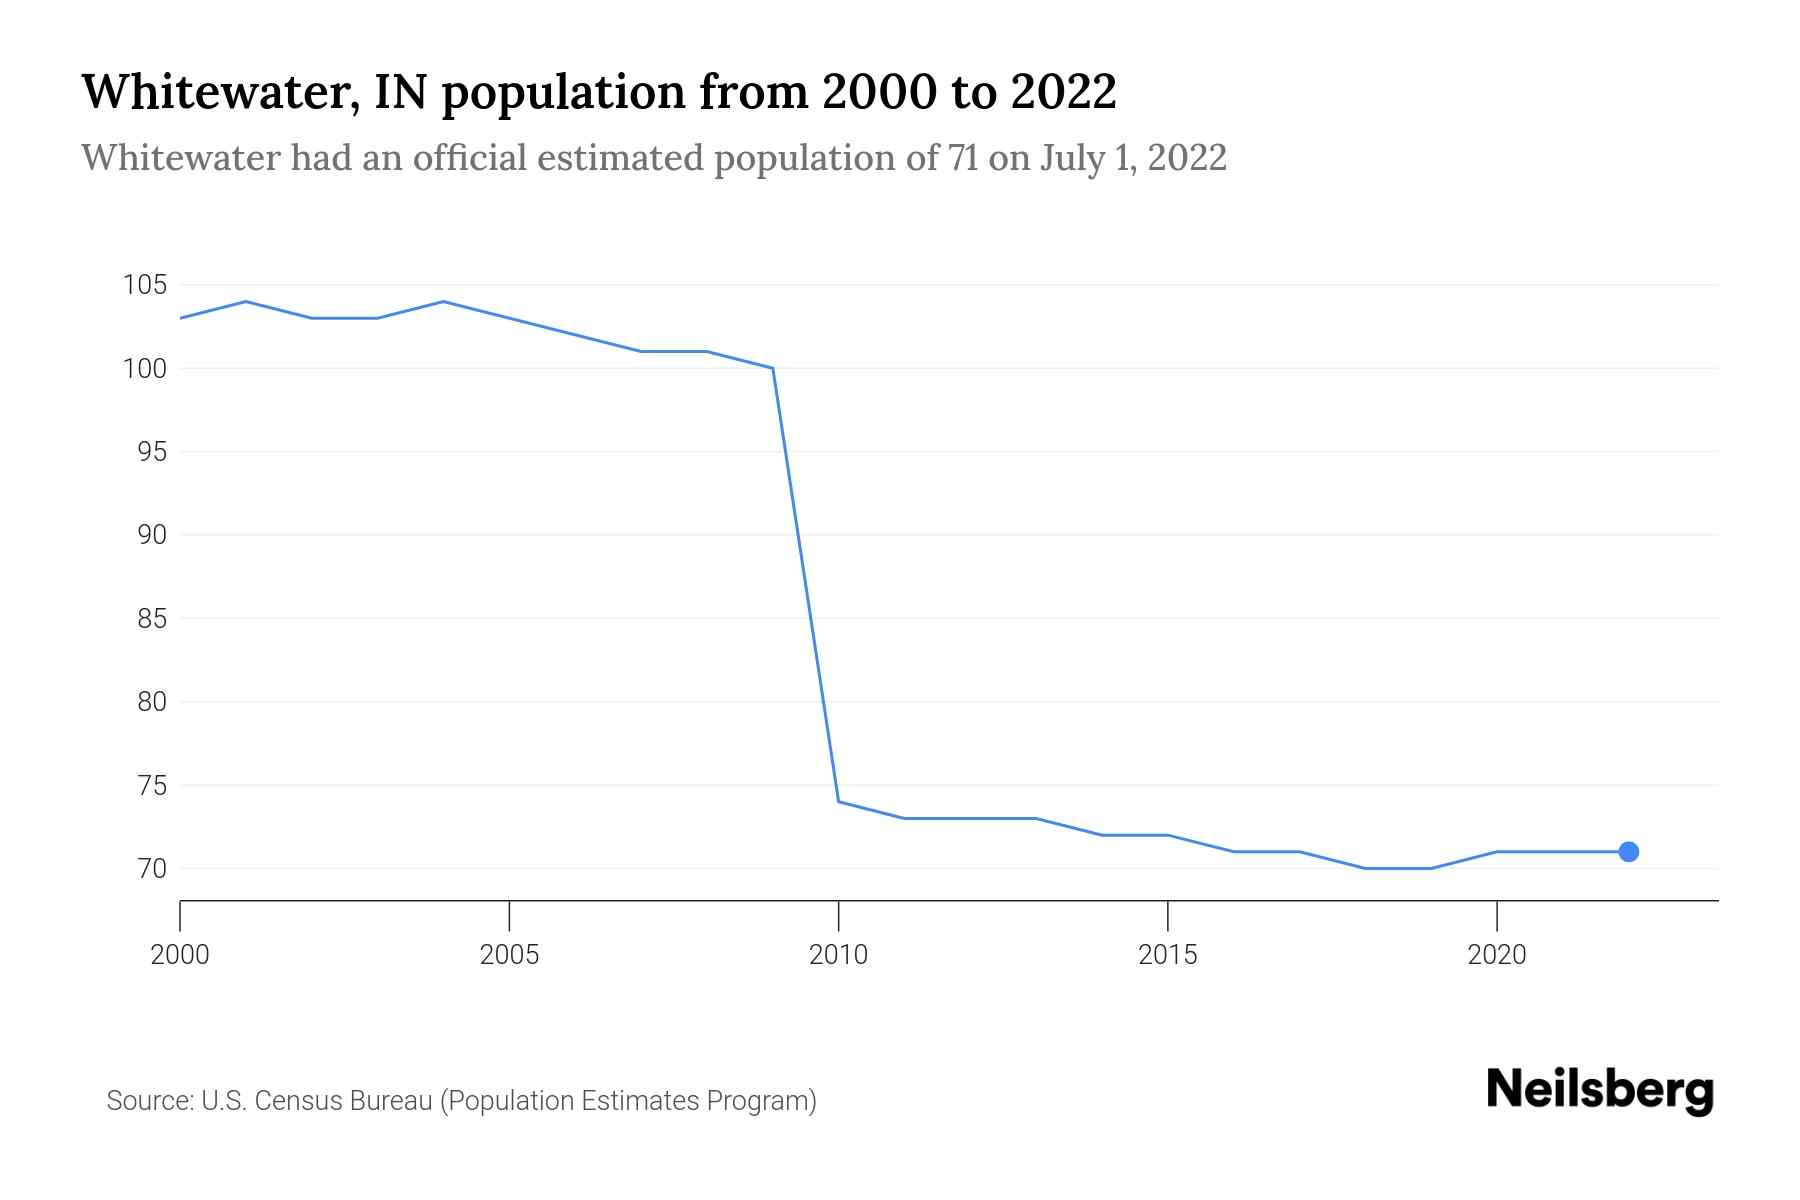
In 2022, the population of Whitewater was 71, a 0.00% decrease year-by-year from 2021. Previously, in 2021, Whitewater population was 71, a decline of 0.00% compared to a population of 71 in 2020. Over the last 20 plus years, between 2000 and 2022, population of Whitewater decreased by 32. In this period, the peak population was 104 in the year 2001. The numbers suggest that the population has already reached its peak and is showing a trend of decline. Source: U.S. Census Bureau Population Estimates Program (PEP).
Content
When available, the data consists of estimates from the U.S. Census Bureau Population Estimates Program (PEP).
Data Coverage:
Variables / Data Columns
-
Year: This column displays the data year (Measured annually and for years 2000 to 2022)
-
Population: The population for the specific year for the Whitewater is shown in this column.
-
Year on Year Change: This column displays the change in Whitewater population for each year compared to the previous year.
-
Change in Percent: This column displays the year on year change as a percentage. Please note that the sum of all percentages may not equal one due to rounding of values.
Good to know
Margin of Error
Data in the dataset are based on the estimates and are subject to sampling variability and thus a margin of error. Neilsberg Research recommends using caution when presening these estimates in your research.
Custom data
If you do need custom data for any of your research project, report or presentation, you can contact our research staff at research@neilsberg.com for a feasibility of a custom tabulation on a fee-for-service basis.
Inspiration
Neilsberg Research Team curates, analyze and publishes demographics and economic data from a variety of public and proprietary sources, each of which often includes multiple surveys and programs. The large majority of Neilsberg Research aggregated datasets and insights is made available for free download at https://www.neilsberg.com/research/.
Recommended for further research
This dataset is a part of the main dataset for Whitewater Population by Year. You can refer the same here
